Excel Projects
Hotel Chain Storytelling
An explanatory dashboard that recommends a business decision to overbook same-month hotel reservations during a certain time period.
Dataset size: 119k rows
Skills Displayed: Pivot Charts, Conditional formatting, Storytelling
Click here to view.

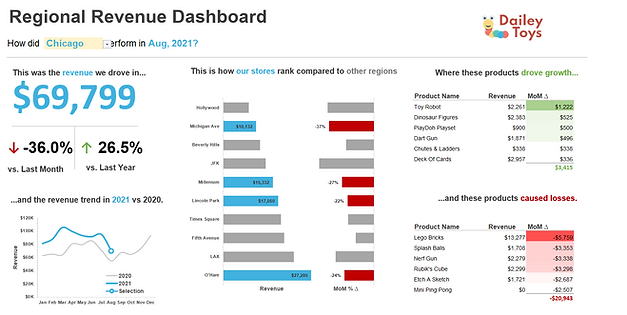
Toy Chain Monthly Sales Dashboard
Monthly exploratory dashboard for regional sales of a toy chain to be used for regional managers.
Dataset Size: 4.5k rows
Skills Displayed: Top N formulas, Previous Period Calculations, Automatic Sorting, Conditional Formatting
Click here to view.
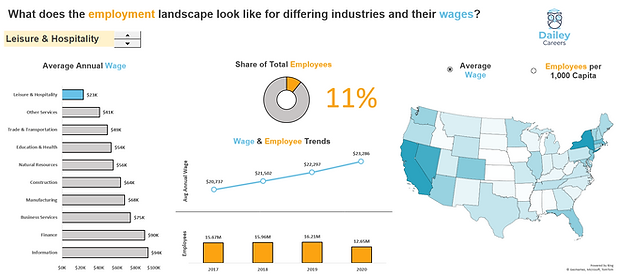
Career Path Dashboard
This dashboard uses data from US labor statistics from 2017 to 2020 and is meant to be used as an exploratory dashboard.
Dataset size: 1.9k rows
Skills Displayed: Statistical & Lookup Formulas, Custom Charts, Dynamically Highlighted Series, Adding Form Controls
Click here to view.
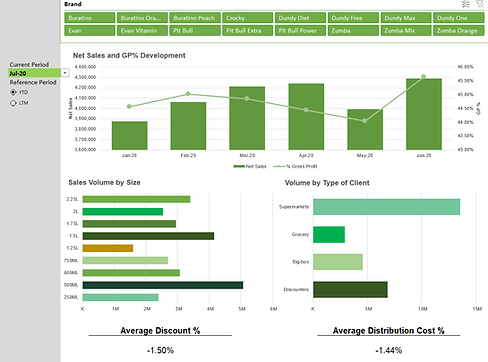
Fast Moving Consumer Goods Dashboard
Exploratory dashboard for a soda company displaying various metrics across a dynamic date range filter.
Dataset size: 88k rows
Skills Displayed: Form Controls, Pivot Charts, Pivot Tables, Advanced Excel Functions, Pivot Slicers
Click here to view.